Management Strategy Evaluation for Abalone Fisheries
Preface

The aim of this document is to introduce and provide examples for using the Management Strategy Evaluation (MSE) software encapsulated within the aMSE R package (and associated required packages). While the aMSE package is aimed at abalone fisheries, it could also be applied to any hard to age, spatially complex invertebrate fishery such as Beche de Mer. Nevertheless, at least in this first edition, all examples will focus upon abalone fisheries, both real and hypothetical.
What are Harvest Strategies?
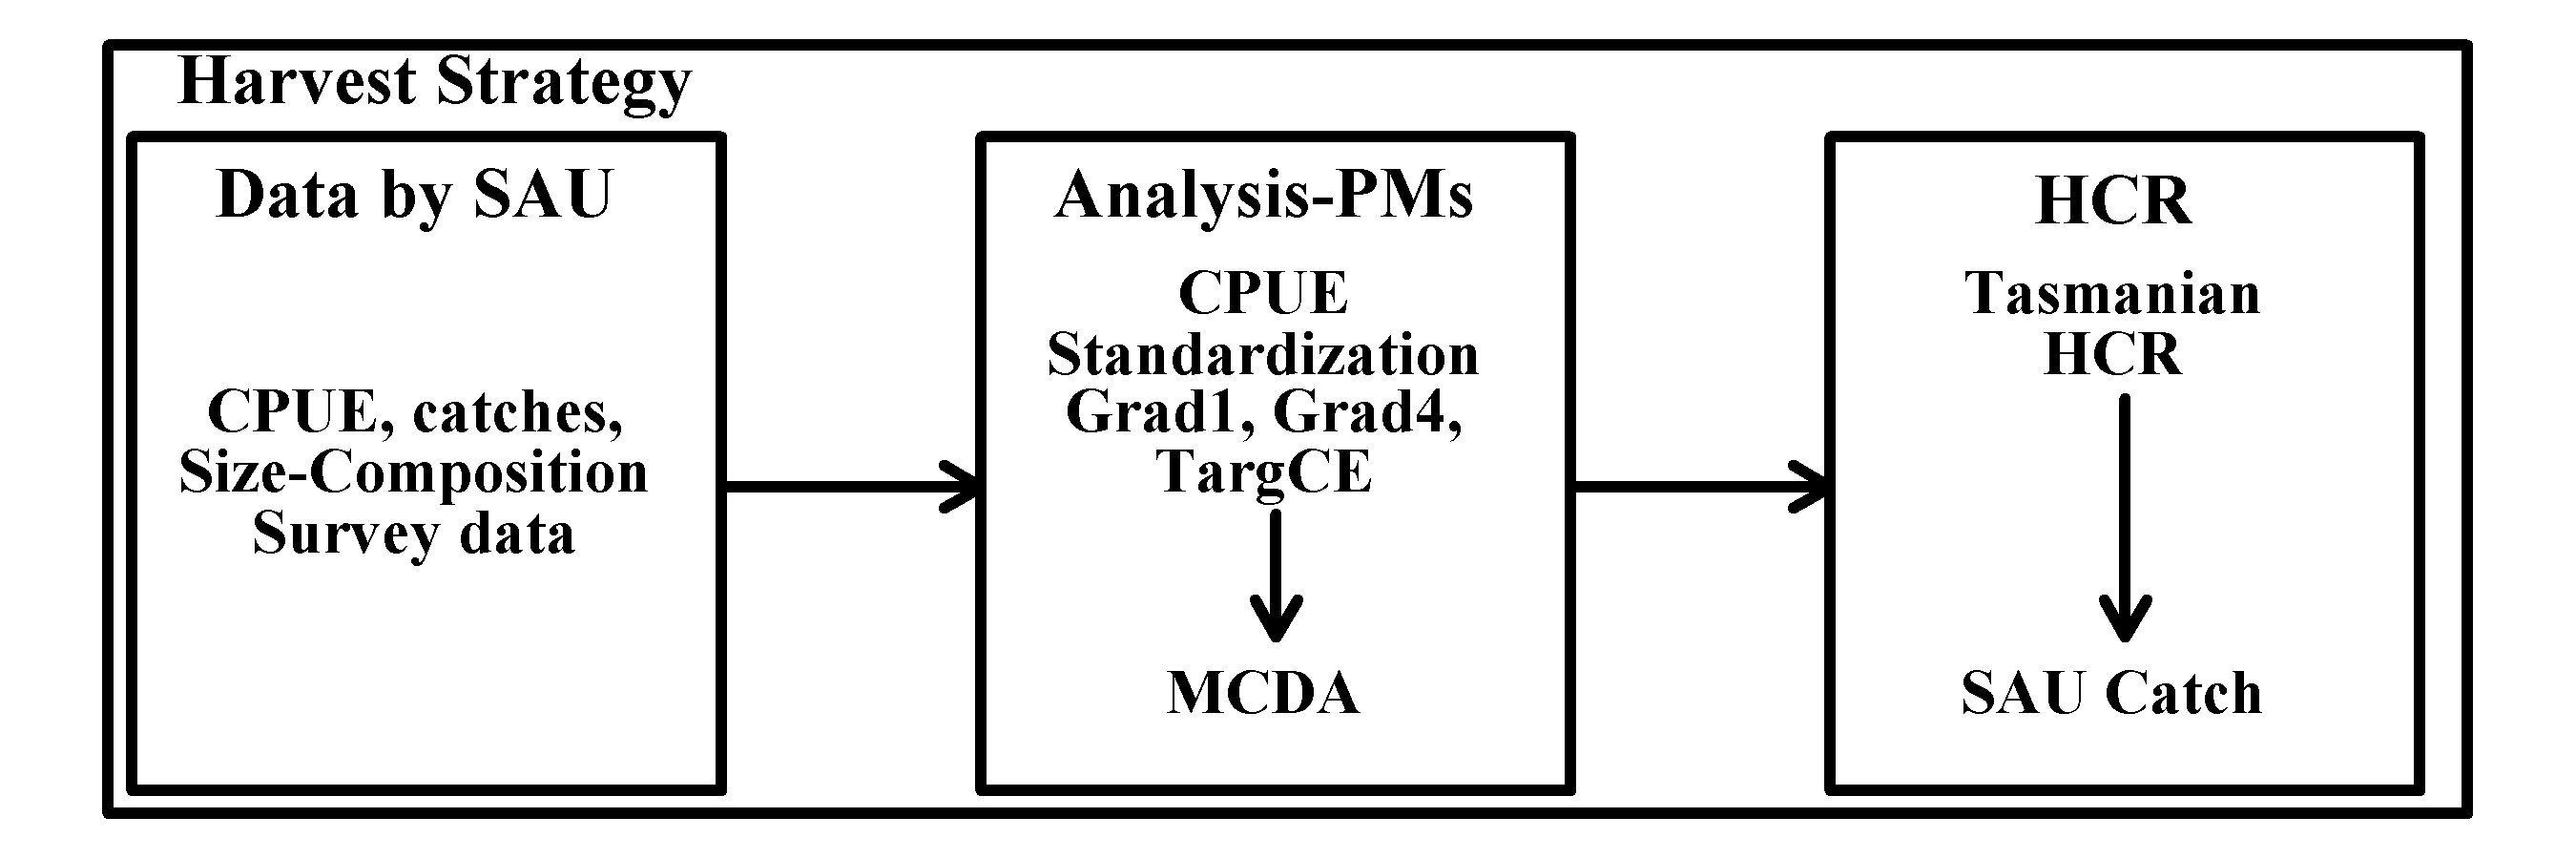
Formal Harvest Strategies (HS) have three components, the data used by the HS, the analyses or assessment used to produce the fishery performance measures and combine them if there are more than one, and the harvest control rule used to translate the output or final score from the analyses into a future catch level (Figure 1). They can be either model-based or empirical. Integrated size-based assessment models can be used with abalone fisheries but generally they tend to be managed using empirical harvest strategies, especially where an exploited species does not meet dynamic pool assumptions.
Testing of Fishery Harvest Strategies
At its heart, MSE is about testing harvest strategies using simulation. The need for such simulation testing arises because while harvest strategies are invariably devised with the best intentions to provide for sustainable fisheries management of profitable fisheries, even relatively simple systems can develop what are termed unintended consequences. While unintended outcomes can be benign, they can also lead to pathological behaviour, such as an inability to increase or decrease total allowable catches when such changes are needed. It is possible to apply new harvest strategies to real fisheries and discover their implications, both good and bad in real time, over a possibly large number of years. However, it is less risky to simulate the fishery and its management under alternative harvest strategies and, at very least, eliminate the worst options while retaining those that appear beneficial. Enabling such simulations is the intent behind producing aMSE.
The Design of the aMSE R Package
Apparently, when writing software, one should start with a very precise specification of the intent of the software, which should define the inputs and how those are manipulated to generate the outputs. Unfortunately, in our current ‘real’ world, in terms of abalone (and every other hard-to-age, spatially complex invertebrate) it is clear that not everything that it would be useful to know is already known. In addition, the software is intended to be generally usable by, at least, all Australian abalone jurisdictions and this immediately meant that the software needed to be flexible and adaptable. Thus, rather than starting with a precise specification a more iterative design process was undertaken that could react to innovations such as providing clear descriptions of such things as environmental perturbations.
The underlying population dynamics used to describe changes in the simulated abalone stocks (extremely hard to age both consistently and accurately) was based upon following how the numbers-at-size changed as a result of natural mortality, somatic growth, fishing mortality, recruitment, and small amounts of larval movement. The spatial complexity possible within each simulated fishery also had to be flexible and a scheme of sub-dividing each simulated quota zone into a set of spatial assessment units, each of which could contain a variable number of almost independent populations was adopted. The simplest arrangement possible within aMSE is now a Zone with a single spatial assessment unit (sau) with only a single population. The upper level of complexity has not been defined but in principle there could be dozens of sau with hundreds of populations. In reality, the difficulties in relating the simulation to a real fishery, i.e. conditioning the model on a real fishery is constrained by the availability, and spatial scale, of information and data) will be what places a limit on the spatial complexity adopted in any given case.
The focus of this document is upon the aMSE software but the requirement of maintaining flexibility in its use led to the development of two new auxiliary R packages (see sizemod and makehtml) and the further development of two others (see codeutils and hplot). When conditioning the simulation model, so that it closely represents a real fishery, it was found that in order to mimic the observed dynamics of the known history of a given fishery it was necessary to estimate how recruitment varied through the time over which observations were available. Initially, this was attempted within the aMSE software, and this option is still available. However, it was eventually decided (iterative design) that a separate R package, now called sizemod, should be written. This is used to fit a fully articulated size-based integrated stock assessment model (Punt et al, 2013) to data available from each sau separately. This permits an estimate of the productivity of each sau along with providing for the best available description of the historical fishery data. Parameter settings optimized through sizemod are then passed to aMSE. Once all sau are thus conditioned and adapted within the aMSE framework, the MSE then projects that conditioned model forward under the control of the alternative harvest strategies so that comparisons of the outcomes can be made. As can be seen in the chapter titled Using sizemod to condition the SAU package, very different outcomes from the modelling can be obtained simply by selecting different values of natural mortality, steepness, and the hyperstability level of the CPUE. As none of these values are known with any confidence it is not sensible to recommend using sizemod in a formal stock assessment except, perhaps, in those SAU with large amounts of biological and fishery information and in a weight-of-evidence context.
An important aspect of any harvest strategy is that it ought to be adaptable and open to improvement. Hence, it was decided that the software code used to implement each jurisdiction’s harvest strategy would not be built into aMSE but would rather be one of the inputs from each jurisdiction. Initially, this took the form of what is known as a ‘source’ R file but eventually, for Tasmania, this was converted into yet another a specific R package TasHS (for the purposes of the examples in this guide an earlier version of the Tasmanian HS was produced, EGHS, which is the one to be used with this guide). This also meant that HSs developed by each jurisdiction could be maintained and managed more easily. It is recommended that each jurisdiction that wants to use aMSE should develop such a package, although the somewhat less efficient option of using a ‘source’ file of suitable functions remains.
In addition, the other R packages that have been produced provide utility routines for general programming (codeutils) and plotting routines (hplot), while the third (makehtml) provides a convenient method for setting up internal websites that show the plots and tables of results across a number of different pages/tabs, which enable examination of results from single runs and comparisons. While this may all sound complex, worked examples in the pages that follow should clarify how these things interoperate.
The Intended Users
MSE can be a complex business (Punt et al., 2016). aMSE is written entirely in base R (R Core Team, 2024) and is open-source software. This means that anyone with a knowledge of R can discover how it has been implemented. In addition, it can be further developed and maintained by anyone with the correct expertise. But it does not have a nice shiny interface (which would need to have had horrendously complex input screens). Because of this a certain facility with the R language is required to run the software, though the threshold requirement is relatively low, and template R code files are provided for running the software (and can even be generated for a user by the software). Much of the difficulty or complexity in use is setting up each simulation to represent a real fishery. It must be emphasized that such representation (known as conditioning the operating model) need not always be highly specific. Simulation software can be used to explore the implications of many somewhat more abstract abalone-like fisheries rather than the specific Tasmanian western zone blacklip abalone fishery used in the examples. Describing the conditioning of the simulation model is an important part of this documentation.
One reason aMSE does not have a nice ‘shiny’ graphical interface is to retain a high degree of flexibility during this phase in the evolution of this software. This implies that the user needs to understand much of that flexibility to ensure they do not inadvertently represent the fishery being simulated incorrectly. Ongoing developments are expected to include increasing the number of diagnostics that will highlight assumptions and constraints.
Living Documentation
aMSE is not designed to be a fixed or static piece of software. It is expected that new plots, tables, and other outputs will be produced by users and there is no reason these should not be included in the code base for everyone to use. Having common outputs, plots, and tables would make discussion and comparisons between jurisdictions and different users so much easier. For this reason, the series of Quarto documents that make up this document have also been placed onto a GitHub account, currently at https://www.github.com/haddonm/aMSEGuide so they can be amended and improved whenever required. This documentation should therefore always be considered a draft that can be improved. It is available as a readable product at https://haddonm.github.io/AMSEGuide/ from where a PDF of the whole can also be downloaded.
Acknowledgements
Thanks are given for the funding for this project, which was primarily derived from both the Australian Fisheries Research Development Corporation (FRDC Project 2019-118) and the University of Tasmania. Further funding has been provided by the Abalone Industry Reinvestment Fund (projects 2023-63 & 2023-65), which led to expansion and improvements to the aMSE code-base.